

Keeping an eye on usage and limits
Last updated: July 6, 2026
Imagine you have been running "Cozy Closet," an online clothing store, for a few months now, and products and photos keep piling up. One day you go to create one more new Content Type, but a notice pops up saying you have exceeded your limit, and creation is blocked. Or on a day when visitors suddenly flood in, you find yourself wondering, "How much data went back and forth today?" The place that answers questions like these is the usage screen.
The usage screen shows, all in one place, what this Space is using and how much. You can see how many things like products and photos you have made, how much of your transfer volume you have used against the included allowance your plan provides, and how much data has gone back and forth to visitors. It lets you notice this ahead of time, before you reach a limit, and if you need to, clean up what you are not using or move up to a higher plan.
Let me draw one boundary here. This screen is where you see "how much you have used right now." The exact rules for "what each plan's limit is" and "what happens when you go over a limit" are set by Pricing.
Opening the usage screen
- In the left menu, under "Monitoring," click Usage.
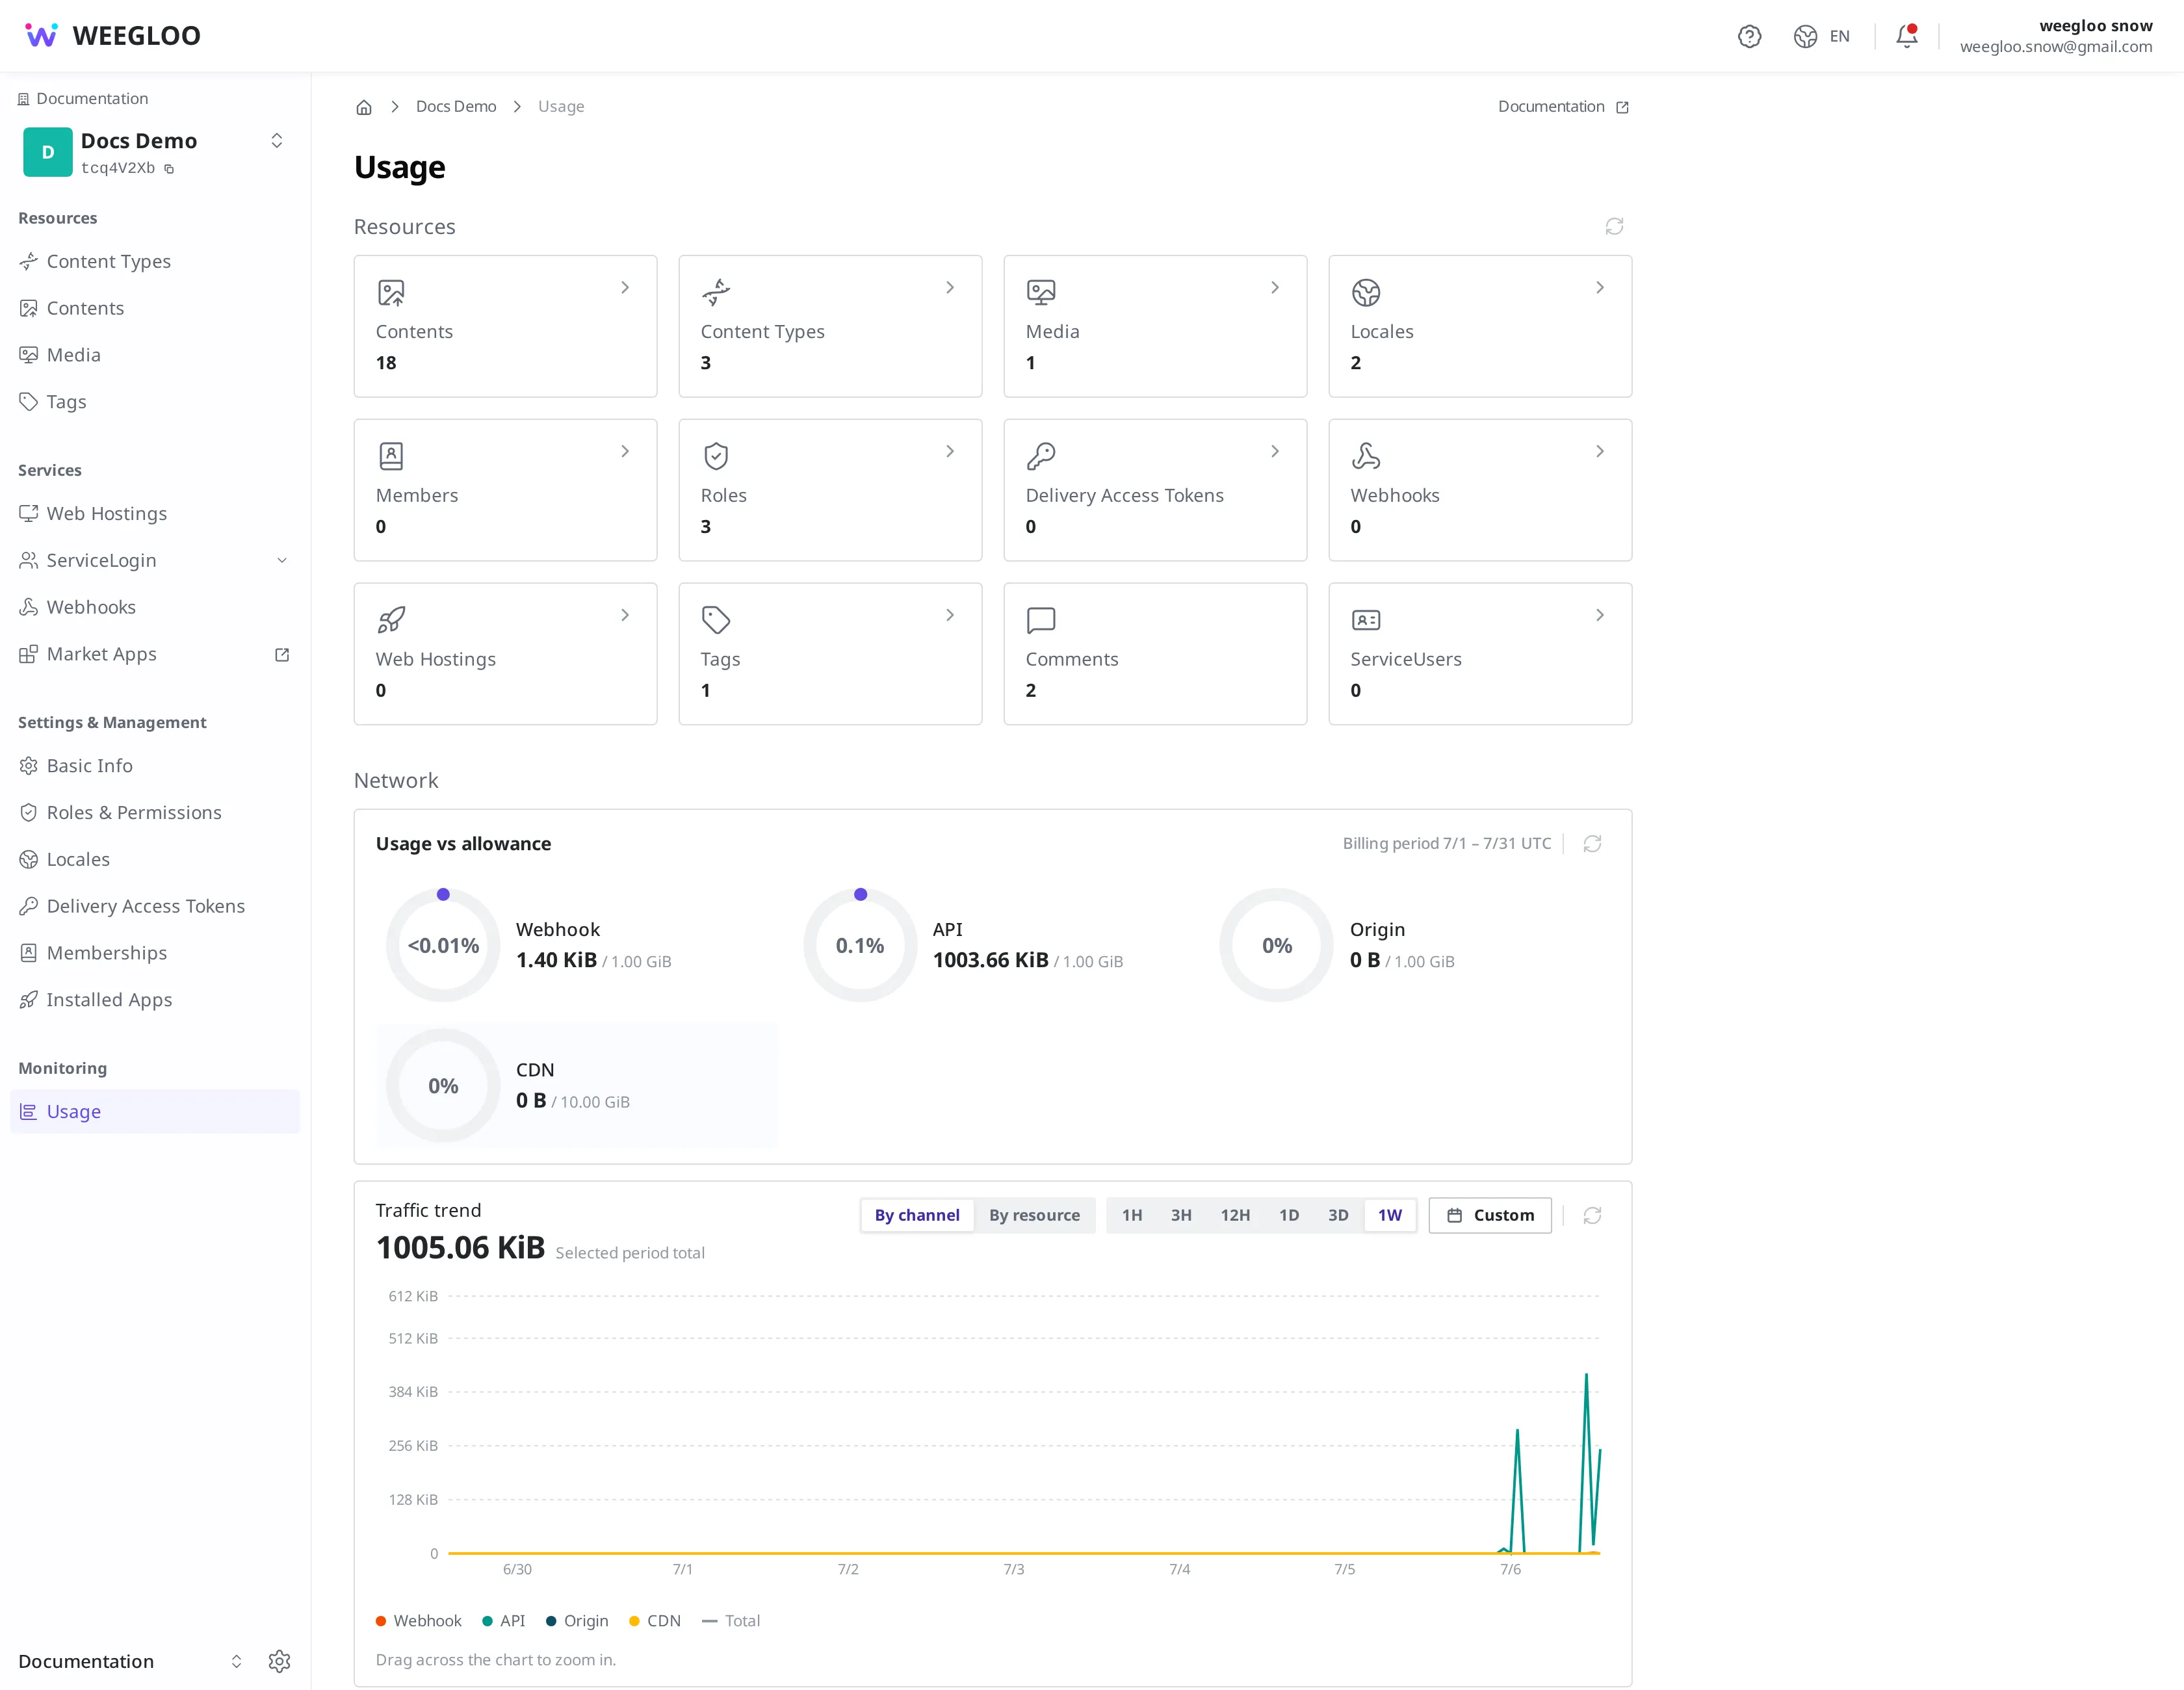
The usage screen is divided into three parts from top to bottom. Under Resources sit the count cards, and under Network sit the gauges and graphs.
- Resources: Shows the number of things you have made so far in this Space as cards by type. Covered in detail below in Resource counts: what you have made and how many.
- Usage vs allowance: Shows with a gauge how much of your transfer volume you have used against the included allowance. Covered below in Usage against your included allowance: how much is left.
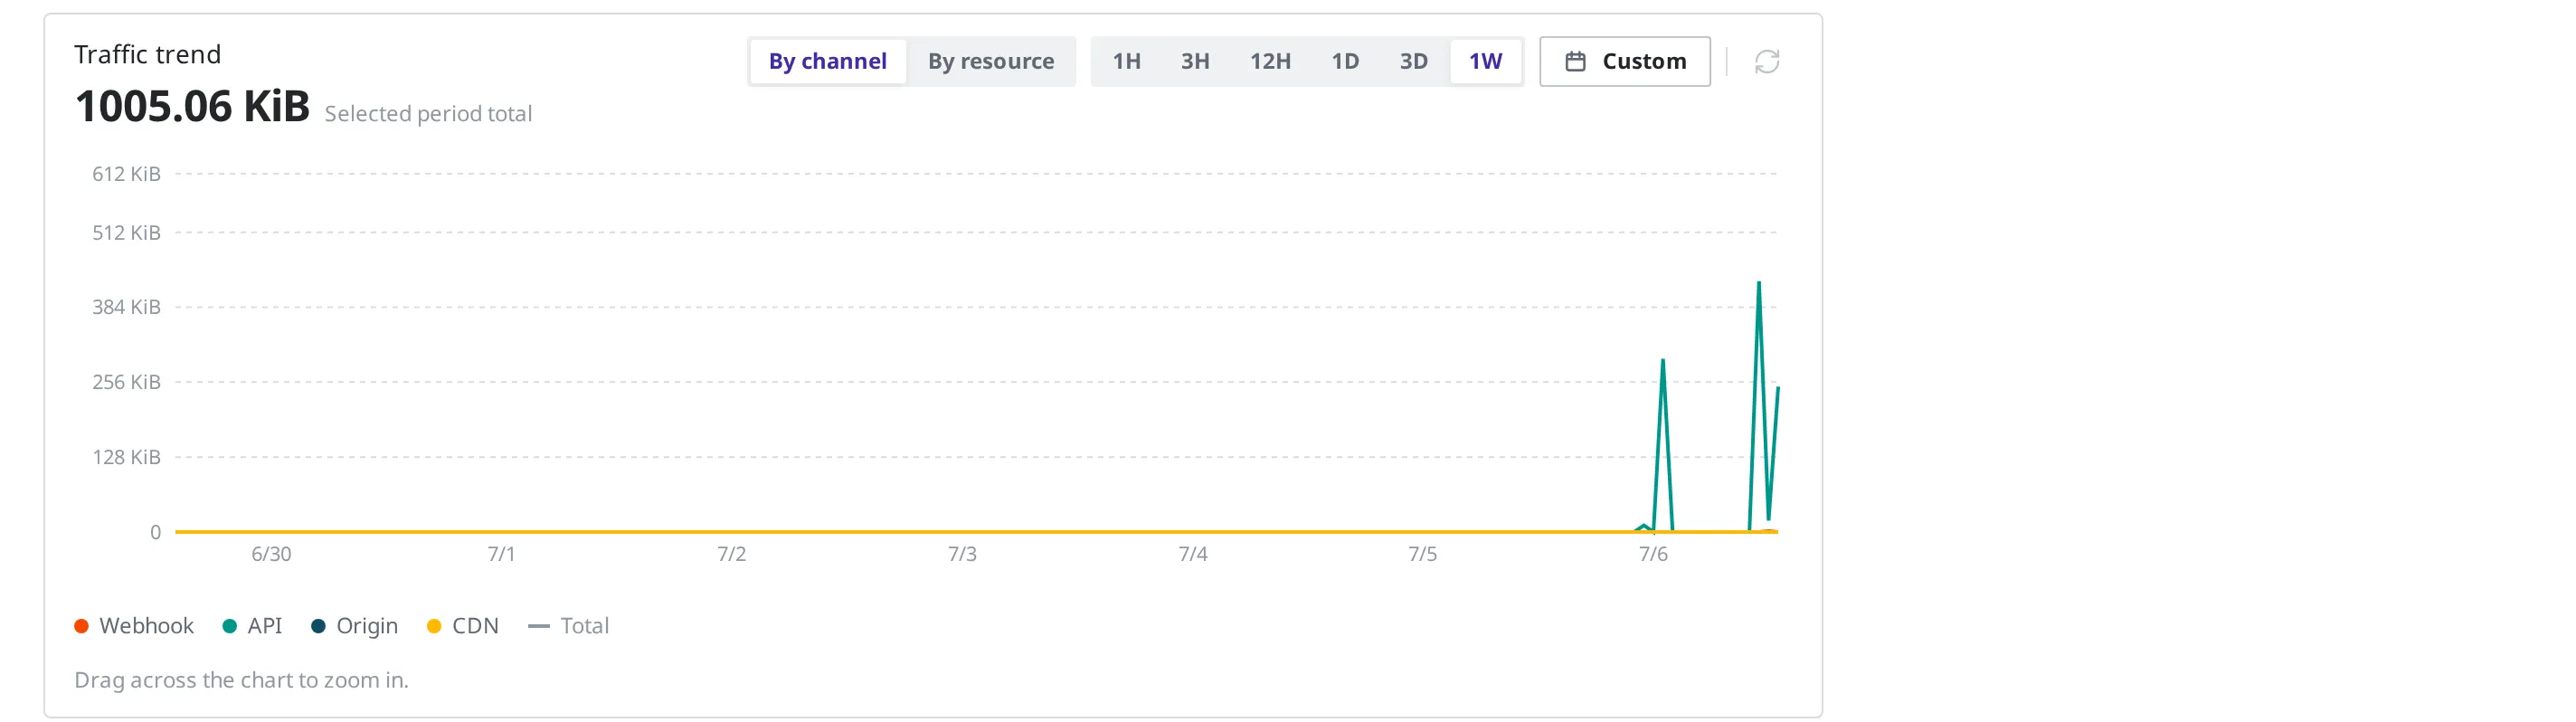
- Traffic trend: Shows with a line graph how much data has gone back and forth over time. Covered below in Traffic trend: the data that flowed to visitors.
Resource counts: what you have made and how many
In the Resources area at the top of the screen, the number of things you have made so far in this Space is shown as cards by type. The resources this Space handles appear as cards by type: Content, Content Type, Media, Locale, members, and Web Hosting, as well as Role, Tag, comments, and users (ServiceUser). You read them like this, for example.
| Card | What it counts |
|---|---|
| Content | Each individual piece of content, such as a product or review you have registered |
| Content Type | Form templates such as Product, Brand, and Review |
| Media | Photos and files you have uploaded |
| Locale | The languages your service supports |
| Members | The people who work together in this Space |
| Web Hosting | The websites you have deployed |
Each card also shows its current count. For example, if you have registered several products and reviews and uploaded one photo, the number of content items you registered shows up on the Content card, and the number of photos on the Media card, exactly as they are.
Clicking a card takes you straight to that resource's list screen. If a count is not what you expected, you can click the card to open the list and check what has piled up, using the methods in Finding the content you need.
Usage against your included allowance: how much is left
Below the resource cards, the Network area has a Usage vs allowance part that shows with a gauge how much of your transfer volume you have used. Here, "included allowance" is the amount your plan provides by default.
Each item appears in the form "amount used / included allowance." For example, it looks like this.
- 2.09 KiB / 1.00 GiB: means you have used 2.09 KiB out of your 1.00 GiB included allowance. The gauge is almost empty.
- 0 B / 10.00 GiB: an item you have not used at all yet.
The number on the left is how much you have used so far, and the number on the right is the included allowance your plan provides. The fuller the gauge gets, the closer you are to the limit, so watch whether the left number is creeping up toward the right one. The items include things like Webhook, API, Origin, and CDN (the delivery network that quickly gets files to visitors).
The included-allowance number on the right differs by plan. To see how much each item is given on your plan, check Pricing.
Traffic trend: the data that flowed to visitors
At the bottom, Traffic trend shows with a line graph how much data has gone back and forth over time. Think of it as the amount of data exchanged as content is delivered to visitors. You use it when you want to see for yourself whether traffic spiked on a day when a summer sale drew a rush of visits, and how much you use on an ordinary day.
At the top of the graph, you can choose from two ways of viewing it.
- Period: choose among 1H, 3H, 12H, 1D, 3D, and 1W, or set your own period with Custom. The first six mean the last 1 hour, 3 hours, 12 hours, 1 day, 3 days, and 1 week, respectively. The flow over the period you chose is drawn on the graph, along with the Selected period total for that period.
- Break it down: By channel breaks traffic down by delivery path, and By resource breaks it down by which resource (for example, Content or Media) the traffic came from.
What happens when you reach a limit
The reason you keep an eye on the usage screen is to respond ahead of time, before you run into a limit. What happens when you reach a limit depends on whether it is a count or a volume.
When you reach a resource-count limit
For each resource, there is a maximum number you can create, set per plan. Once you have made that many, when you try to create a new one of the same kind, a notice saying you have exceeded the limit appears and creation is blocked. Here are some example situations.
- If you have made Content Types up to the maximum number, you cannot make any more form templates.
- If you have invited members up to the maximum, you cannot invite any more members.
- If you have made Roles in a single Space up to the maximum number, you cannot make any more Roles.
The maximum number differs by plan. To see your plan's limits, check Pricing.
When you are blocked, you resolve it in one of two ways: free up space by clearing away what you are not using (for example, deleting old content by following the steps in Publishing Operations), or move up to a higher plan.
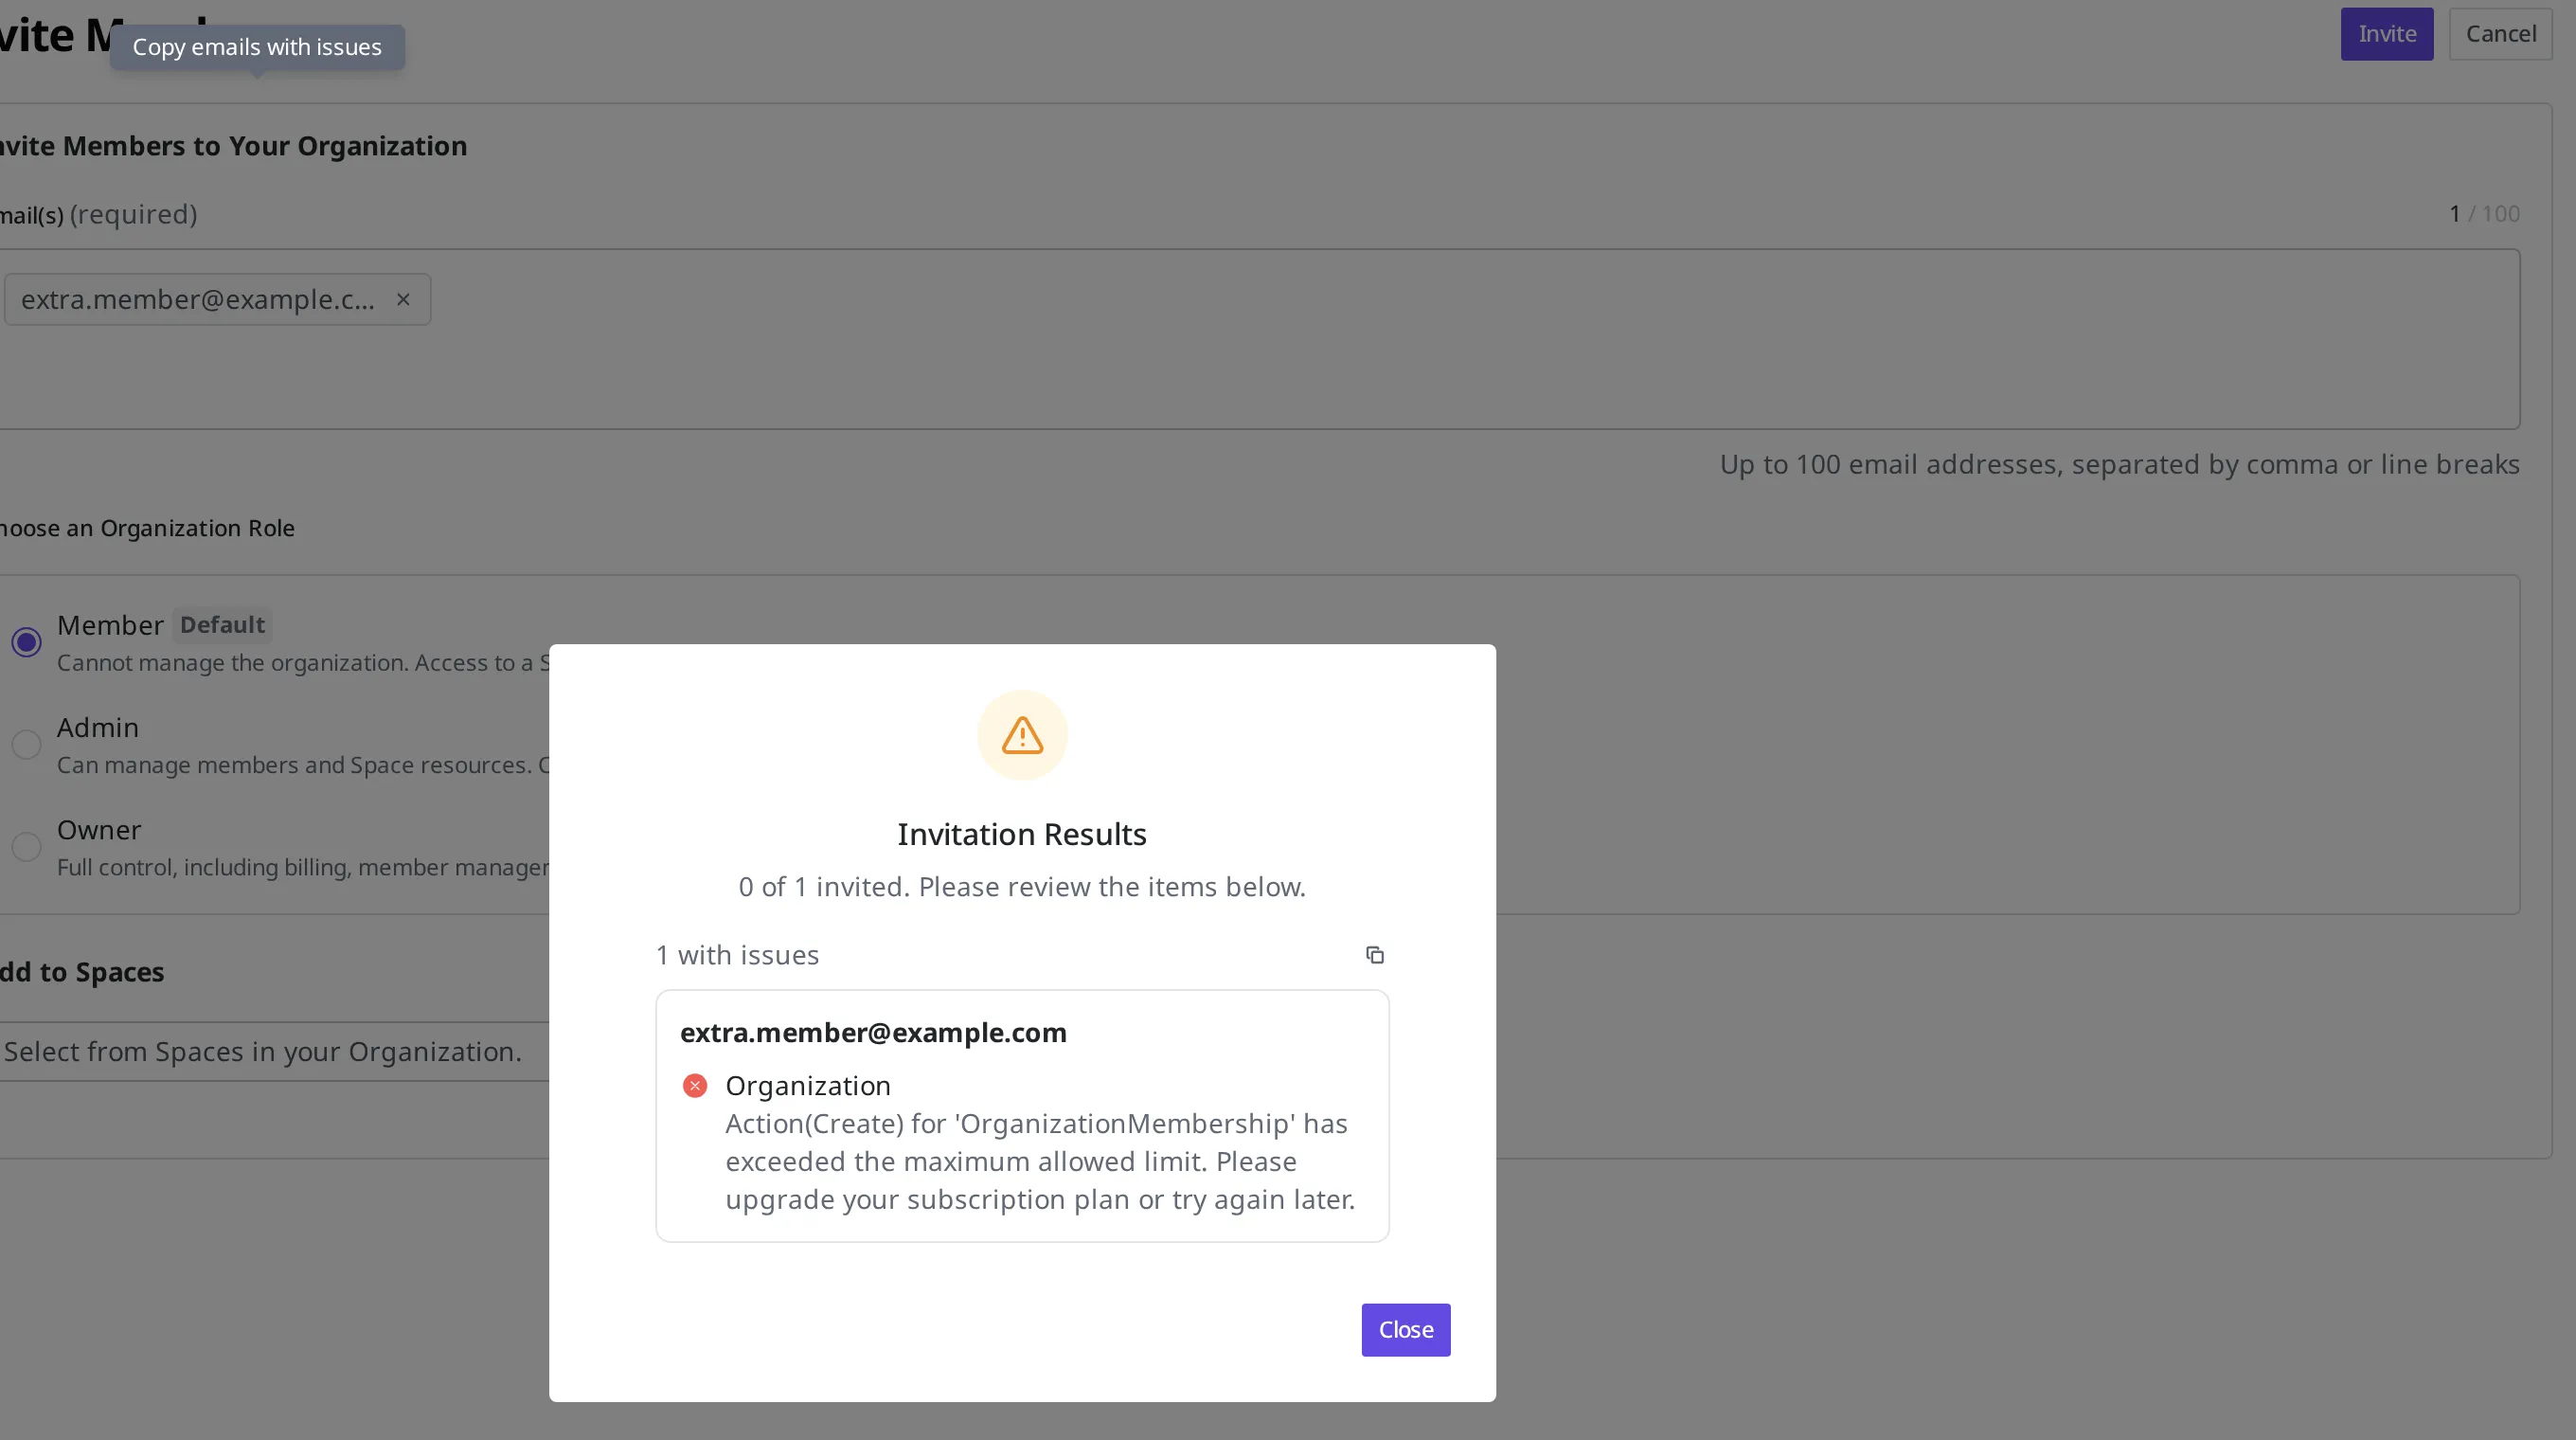
For example, if a member invitation runs into a limit, then after you run the invitation, the "Invitation Results" notice marks it as a failure, like "0 of 1 invited." Below the email that had the problem, along with what hit the limit, a notice reads, "…has exceeded the maximum allowed limit. Please upgrade your subscription plan or try again later." This notice appears the same way not only for member invitations but also whenever you hit a limit while creating any other resource.
When your transfer volume exceeds the included allowance
Rather than being cut off cleanly like a count, transfer volume gets throttled according to your plan once it goes past the included allowance. Exactly what happens differs by plan, so check Pricing.
That is why it is good to check ahead of time, before the Usage against your included allowance gauges fill up. If a gauge is getting close to the right end, it is time to look into what is driving the traffic, or to consider moving up your plan.
What to do next
- Pricing: Covers each plan's resource limits and included allowances, and the rules for when you go over a limit.
- Publishing Operations: Covers how to manage publishing states and the steps for tidying up accumulated Content by archiving or deleting what you no longer use.
- Changing forms on a live service: Covers how to reshape your service's structure by tidying up Content Types and Fields.