

Monitoring external integrations
Last updated: July 6, 2026
The online clothing store "Cozy Closet" has set up a Webhook (an integration that sends a notification to an outside program whenever something changes in your content) so that whenever a new product is registered, an in-house notification bot is told about it automatically. Then one day the person in charge says, "Lately the new-product alerts just aren't coming through." The first thing to sort out is whether the alert really did not go out, or whether it went out but the bot missed it on its end.
A Webhook is a device that runs on its own once you set it up, so normally there is nothing to attend to. But the outside program that receives the alerts sits somewhere beyond your reach, so a day comes when it does not respond or returns an error. This page covers, as situation-by-situation recipes, how to check whether the Webhook you set up is firing properly, and how to find failed calls and respond according to their cause.
What a Webhook is, and how to create, turn on, turn off, and edit one, are covered in Webhook. Here the focus is on operating and monitoring a Webhook you have already made.
What the call history records
Every time a Webhook sends a request to an outside program, each of those is left as a record in the call history. Each record holds the following.
- When it was sent, and how long it took to process
- What change triggered it (for example, a product being registered)
- Which address it was sent to
- The response code the outside program returned (the result number that tells you how it handled the request)
- Whether that call succeeded or failed
The call history has two layers. First there is a list that runs through the calls in time order, and when you open one entry from the list, the details of that call appear. In the details you can see, exactly as they were, the request we actually sent and the response the outside program returned.
When you click a name in the Webhook list, the detail screen opens, and this list appears in the Webhook Calls tab at the top. The records that "Cozy Closet"'s New Product Alert Bot sent each time a product was registered look like this.
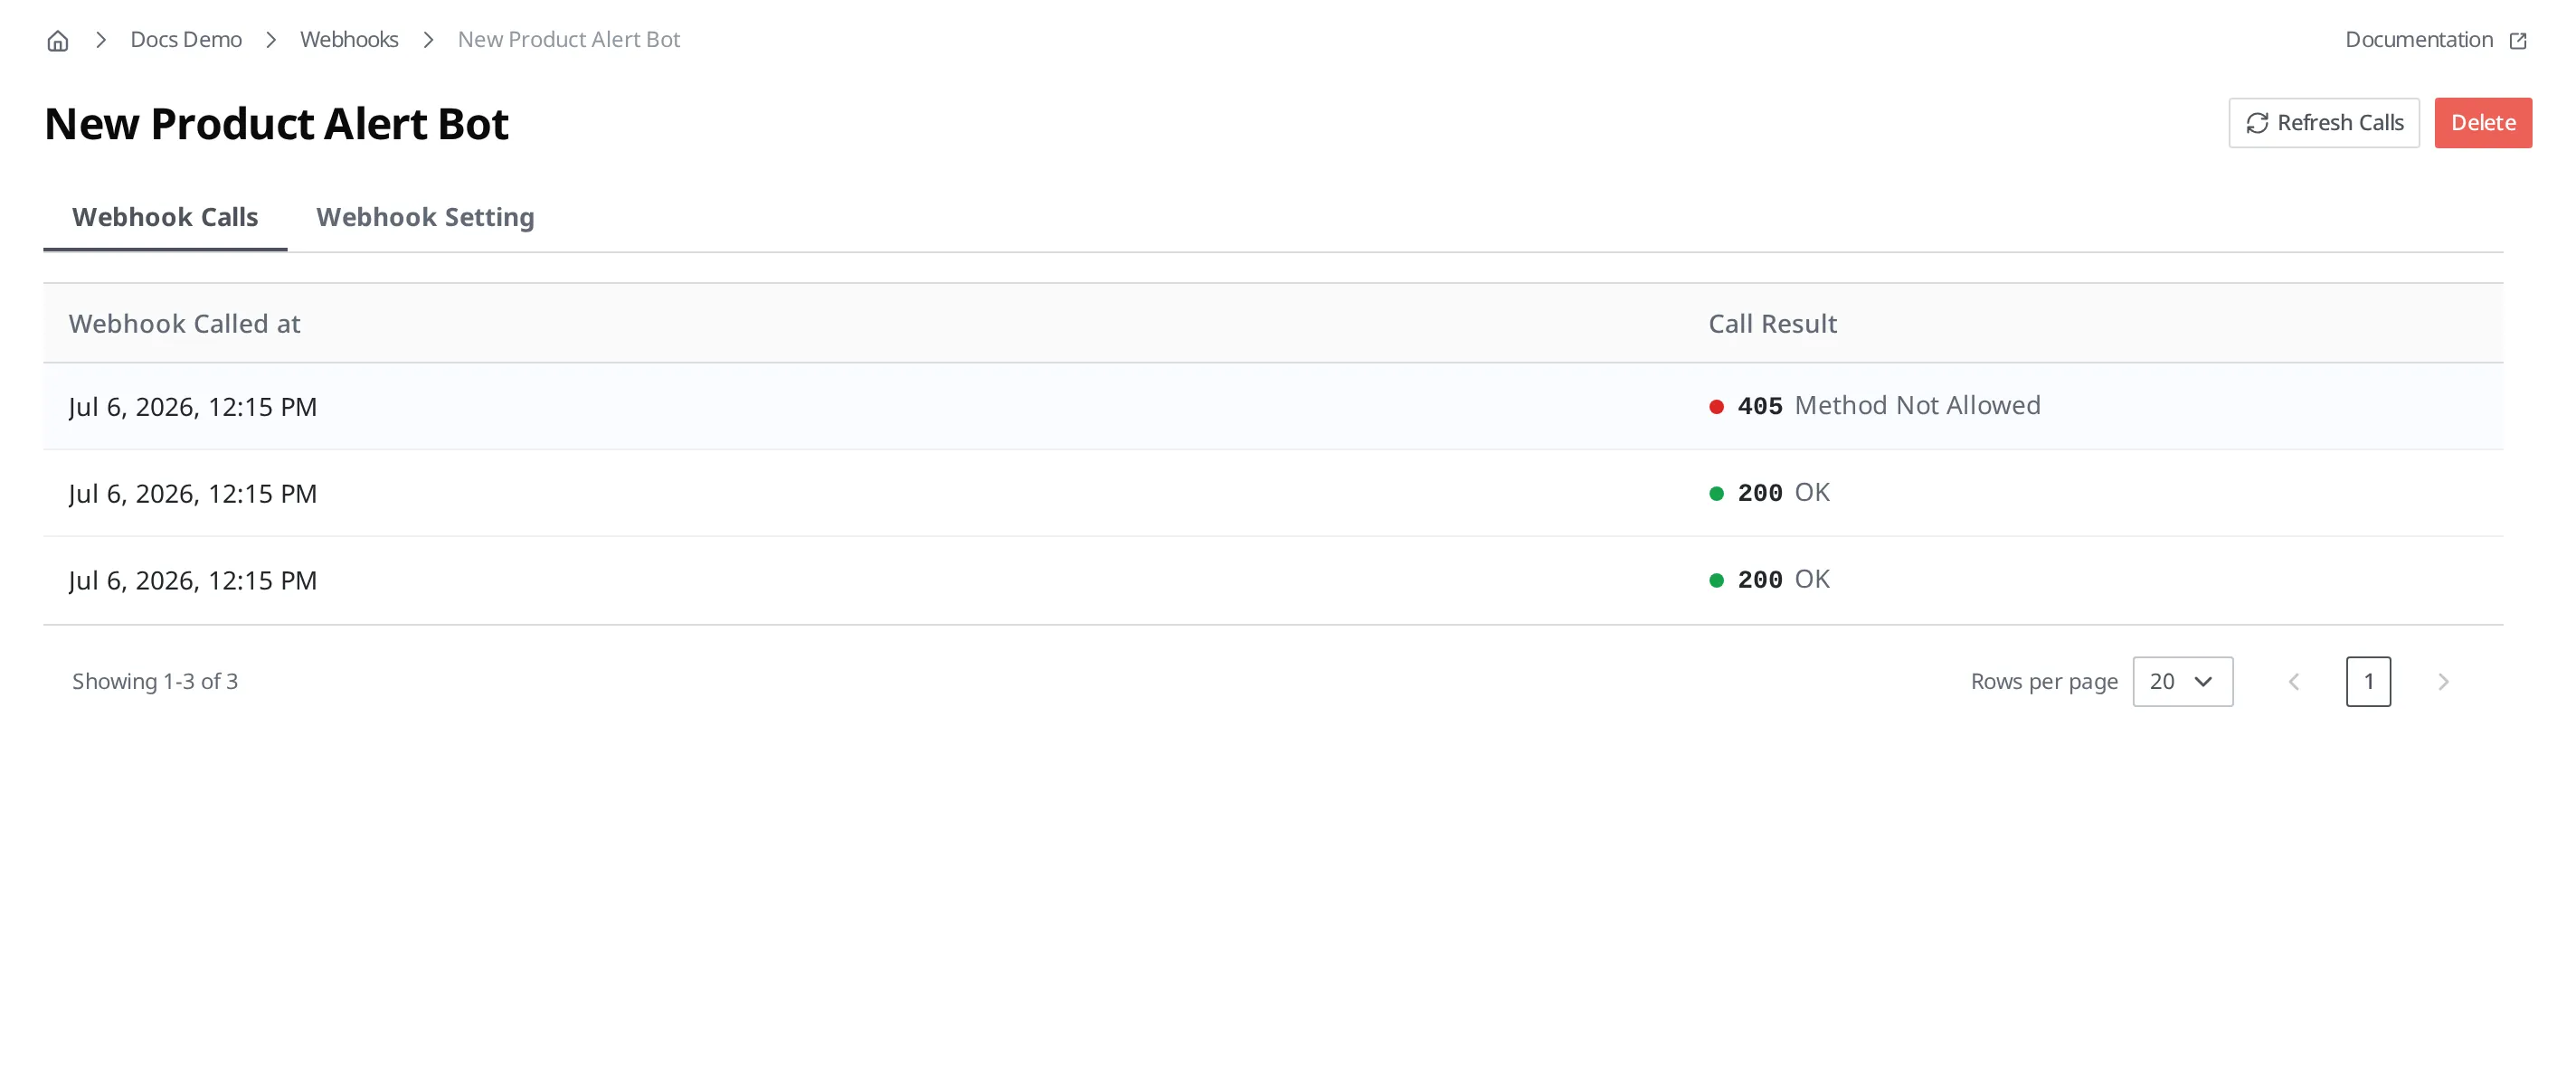
The list shows only the Webhook Called at and Call Result in brief; the rest of the information, such as which address something was sent to and why, appears only when you click a row to open its details. If the list looks out of date, you can reload it with Refresh Calls at the top right.
Success and failure are decided by the response code. If the response code is in the normal range (typically the 200s and 300s), it is recorded as a success; any other number is recorded as a failure. If the outside program did not respond at all, or the response it returned was too large, that call is also left as a failure.
Checking that alerts are going out
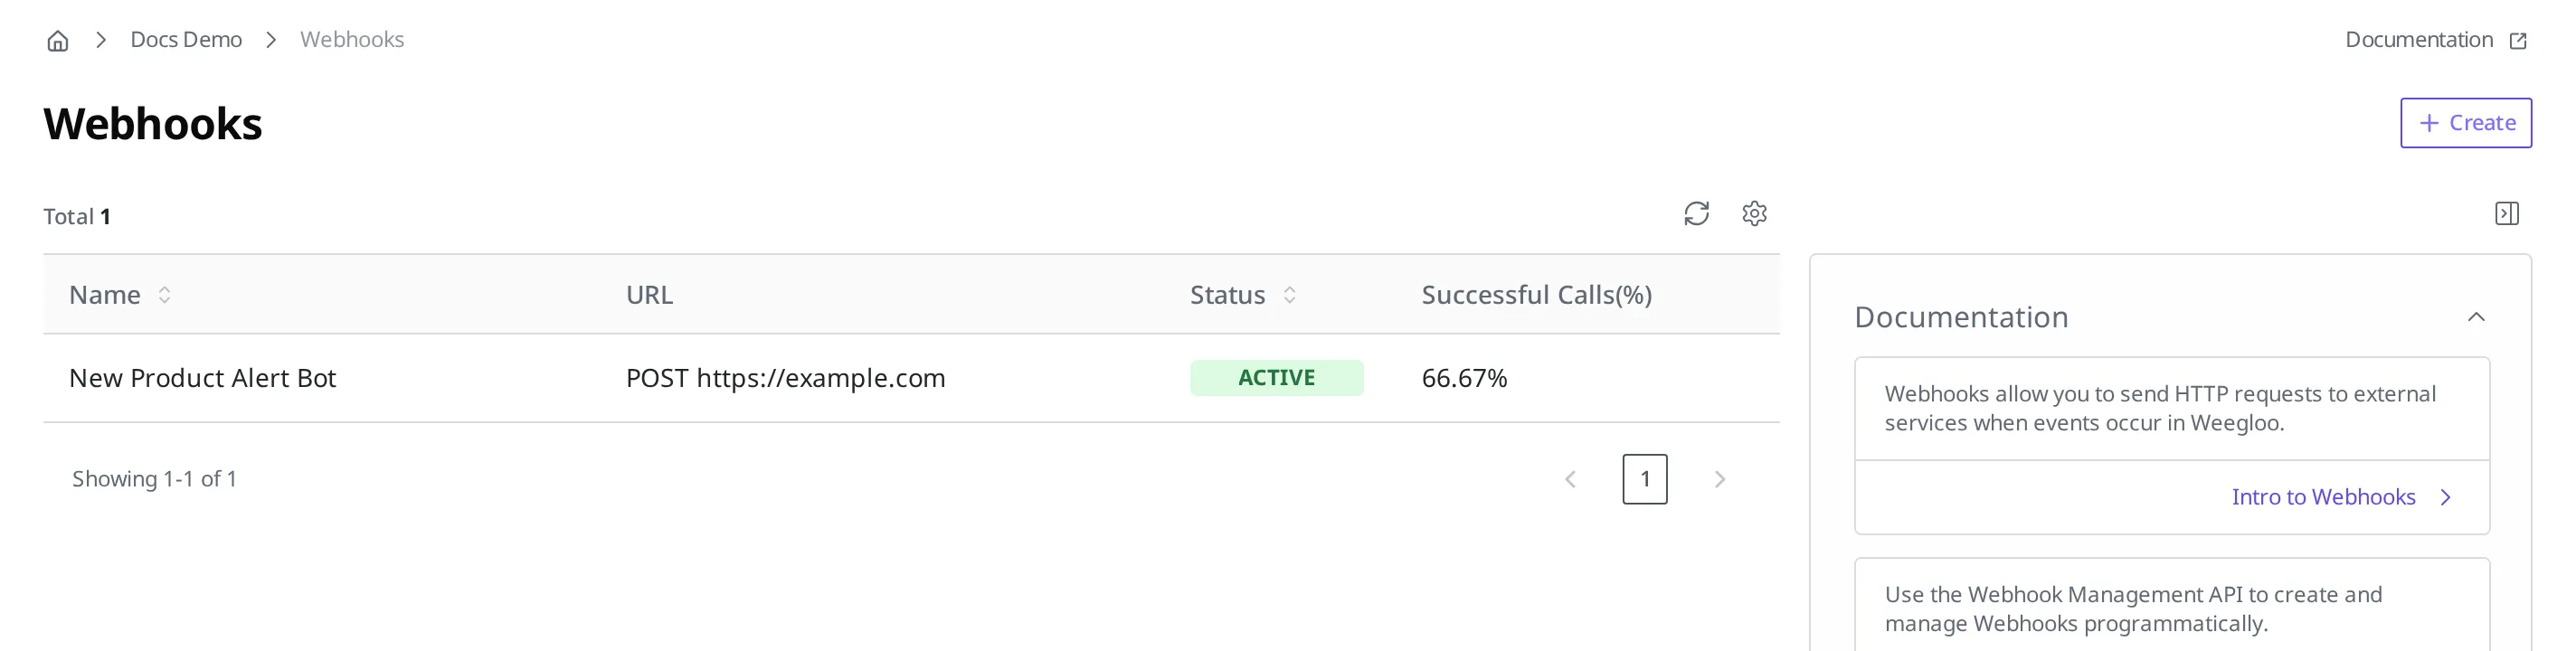
To check whether the person in charge is right, first look at what percentage of the calls this Webhook has sent so far succeeded. The call success rate is shown right there in the Webhook list.
- Open the Webhook screen in the clothing store Space's settings.
- In the list, check the Successful Calls(%) column on the
New Product Alert Botrow.
For example, it might read "66.67%." If it is 100%, every call sent so far succeeded, and in that case it is the bot that missed them. If it is lower than 100%, that means the alert itself has been blocked on its way out at some point, so the next section finds the cause.
If not a single call has been sent so far, the alert did not fail; it was simply never sent. That happens when the Webhook is turned off (INACTIVE), or when no change matching the condition you set has occurred in the meantime. In that case, check in Webhook whether it is turned on, and what change you set it to react to.
Finding the cause of a failed call
When you see a failure, open that one call and see what went wrong. The details show the request we sent together with the response the outside program returned.
- In the
New Product Alert Bot's Webhook Calls tab, click a row whose result is a failure. The Webhook Call Detail screen opens. - In Request, check which address you sent what content to.
- In Response, check the response code and the content the outside program returned.
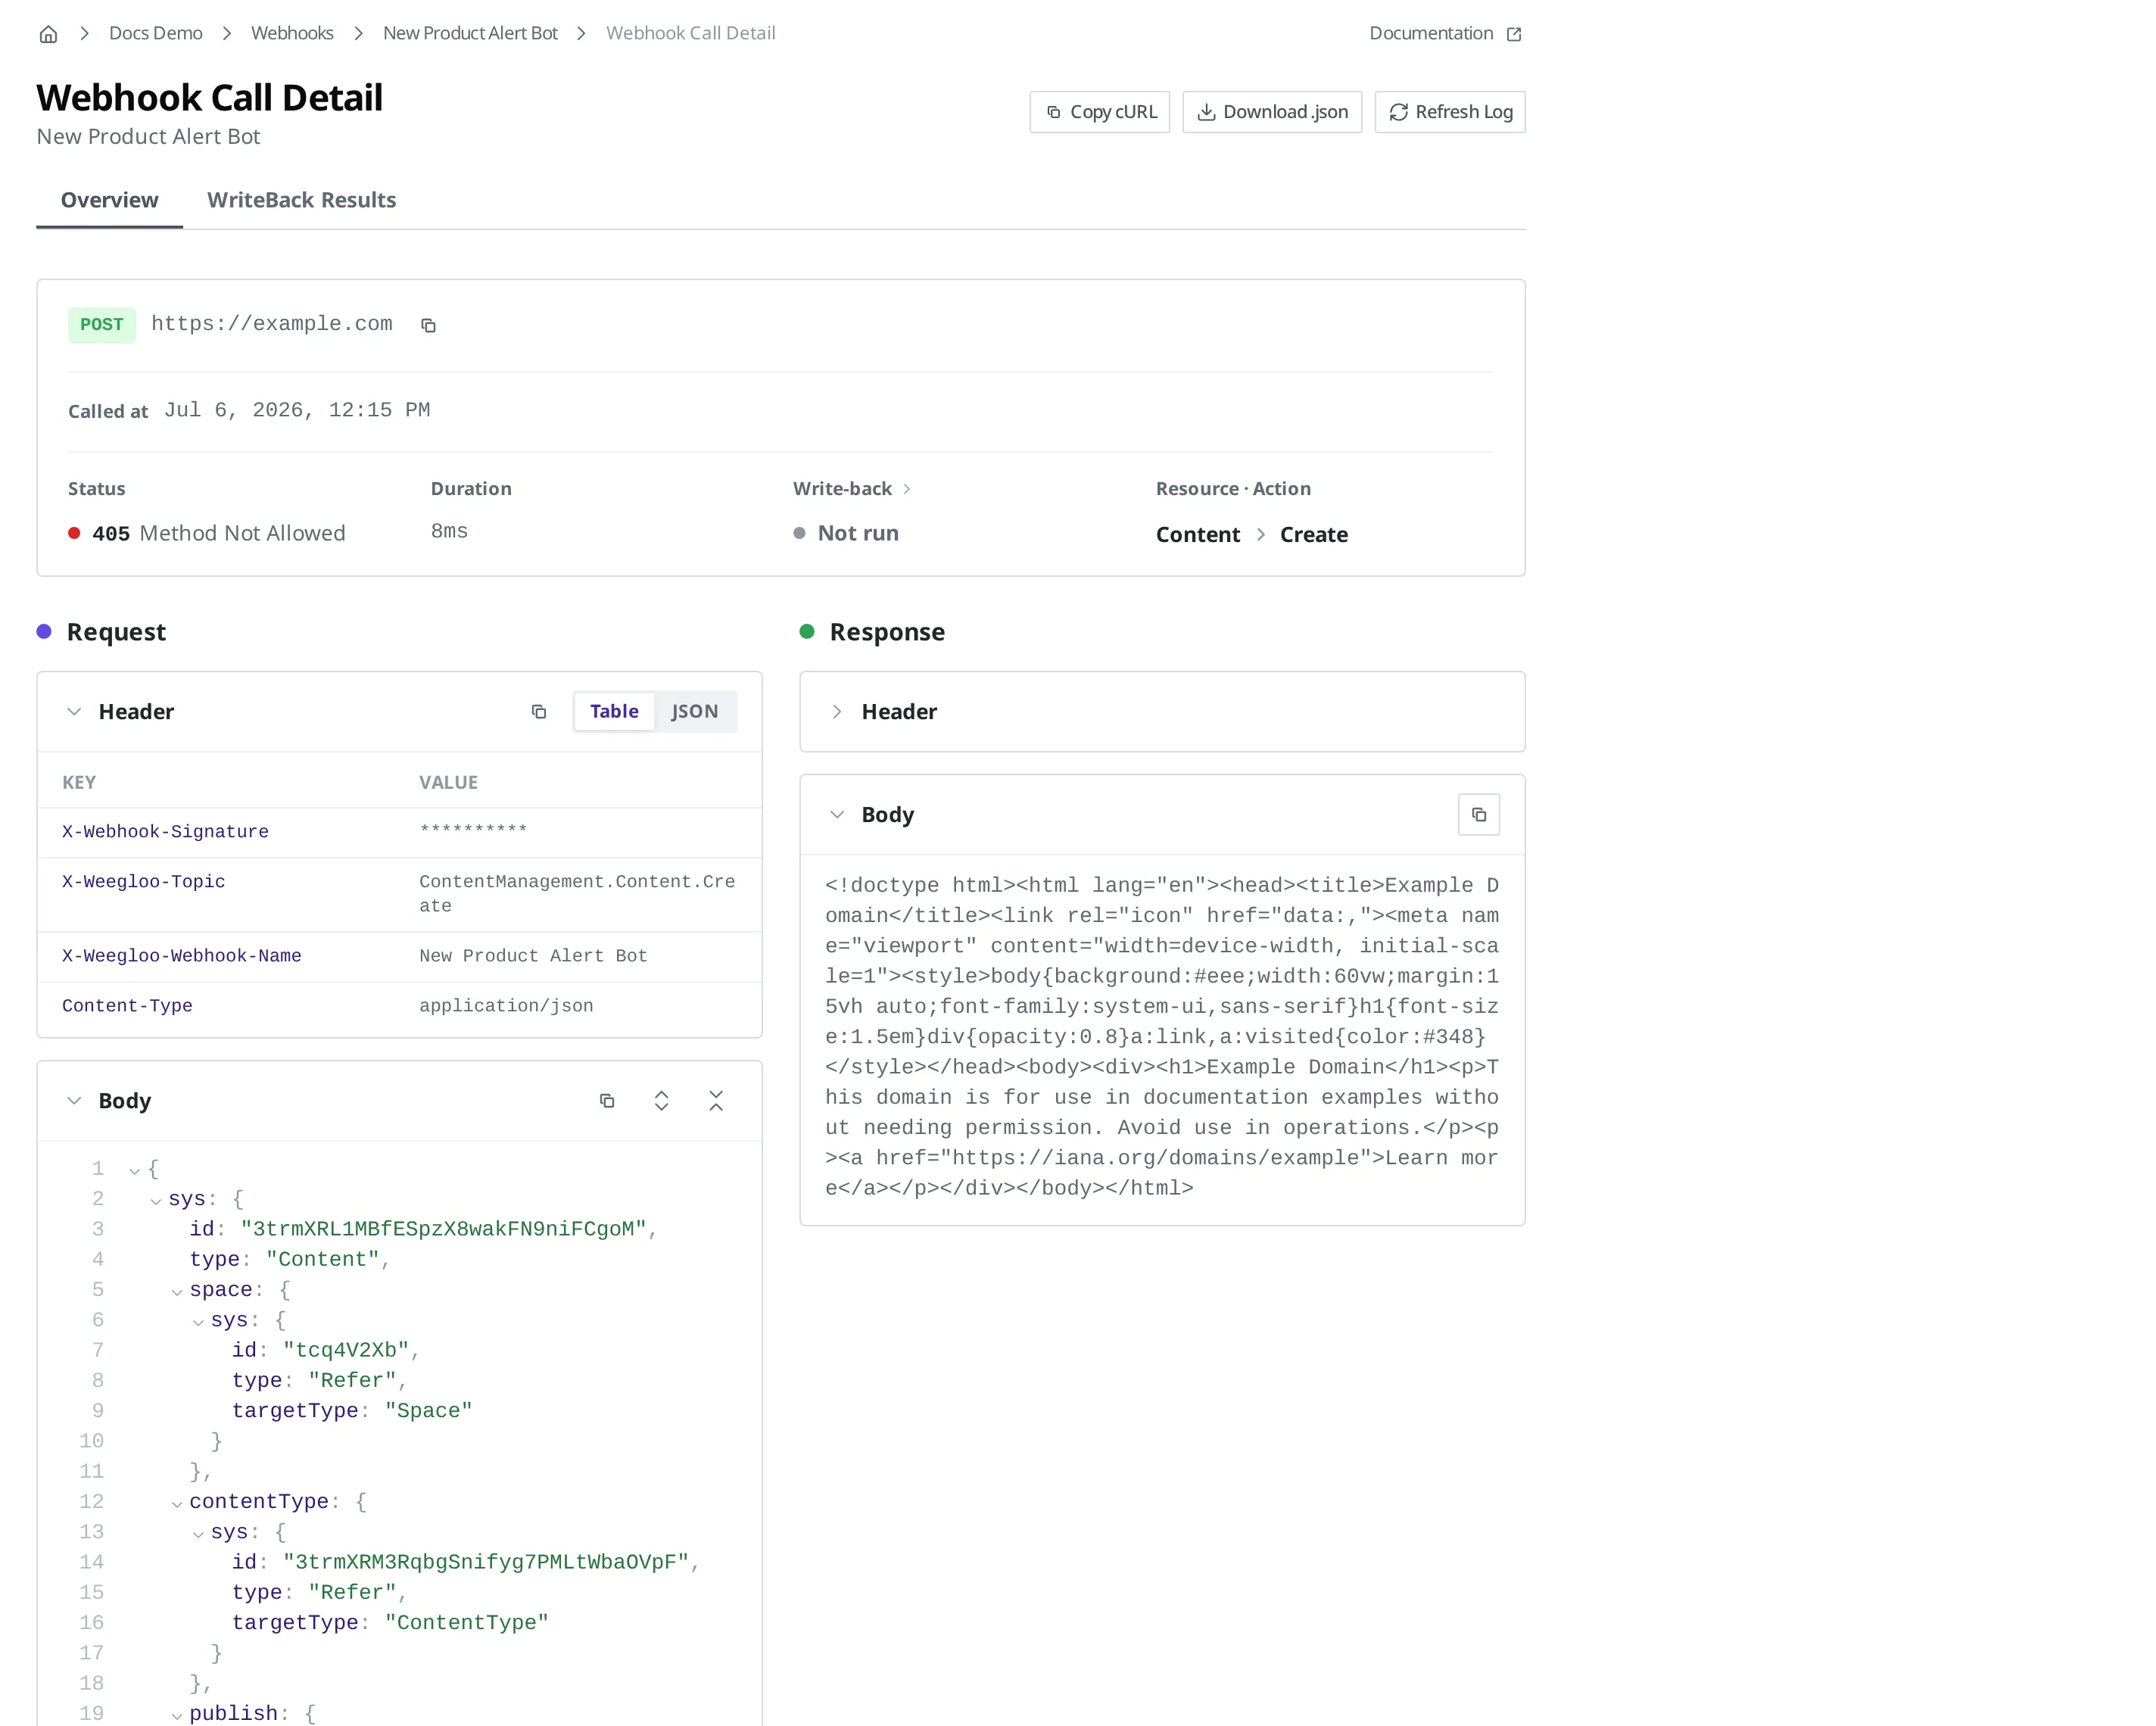
The response code and the returned content tell you the cause. If the response code is in the failure range, the outside program received the request but failed while handling it, and in that case the cause is often written in the content it returned. If there was no response at all, or the address could not be found, the address to send to may have changed, or the program may be down.
If you want to hand this call as-is to the person in charge of the outside program, you can copy it in a form that reproduces the call with Copy cURL at the top right and send it to them.
The request that was sent also includes the headers we sent along with it. Any of them you designated as a secret value (for example, the key value used to connect to the outside program) appear masked with asterisks on the screen. The original value is not exposed, so you can safely check the details.
If this Webhook also uses WriteBack, which fills values back in by returning a response, you can also see whether each of those actions succeeded or failed in the WriteBack Results tab of the same detail view. What each item means is covered in Webhook.
Responding to a failure
There is one thing to know first. A failed call is not resent automatically. An alert that has failed once simply stays in the history; the Webhook does not resend it on its own. So your response splits two ways: fixing the cause so that future alerts go out properly, and personally taking care of the one the bot already missed because it failed.
Depending on what you saw in the details, the causes to consider and how to respond are as follows.
| What you see in the details | Cause to consider | Response |
|---|---|---|
| A response code in the failure range, with error content | The outside program failed while handling the request | Hand the returned response content as-is to the person in charge of the outside program so they fix it on their end |
| No response, or the address could not be found | The address to send to has changed, or the program is down | Check that the address is correct, and if it has changed, edit the Webhook |
| No call is left at all | The Webhook is turned off (INACTIVE) | Turn the Webhook back on |
| Recorded as a failure, with a very large returned response | The content the outside program returns is too large | Adjust the outside program's side so it returns less content |
How to fix the address or turn the Webhook back on is covered in Webhook.
Even after you fix the cause, the alerts that failed in the meantime do not go out again on their own. You can see which product registration each failed call was from in the sent content of that call's details, so for those products, tell the bot's owner directly and fill in the processing that was missed.